Temperature Inversions
Temperature Inversion Basics
An inversion is a meteorological phenomenon that occurs when the temperature of the air with a layer of the atmosphere increases with elevation, instead of decreasing as it normally does. This reversal of the normal temperature profile is called an inversion layer, and it can have significant effects on weather and air quality.
In a typical temperature profile, air cools at a rate of about 5 degrees Fahrenheit for every 1000 feet of elevation gain. This is why it is often colder at higher elevations. However, when an inversion occurs, the temperature profile is reversed, and the air becomes warmer with increasing elevation. This can happen when a cold air mass moves into an area and undercuts warmer air, creating an inversion layer.
Inversion layers can have important effects on air quality, particularly in the winter months. Because the inversion layer acts as a cap on the lower, cooler layer of air, it can trap air pollution near the ground. This can result in a buildup of pollutants and the formation of ozone or smog, particularly in densely populated cities.
During the summer months, inversion layers can also affect the development of thunderstorms. Thunderstorms depend on strong rising currents of air to build and develop. However, if there is an inversion layer present, the rising air will meet the warmer air and be forced back down, effectively suppressing thunderstorm development.
Understanding inversion layers and their effects on weather and air quality is important for meteorologists and anyone interested in the science of the atmosphere.
Identifying Temperature Inversions
An atmospheric temperature inversion can be identified by observing certain atmospheric conditions and present signs. Some indicators to look for include the presence of mist, fog, dew, or frost, low wind speeds (less than 3 mph), and the time of day (inversions are most likely to occur during sunrise or sunset hours). Other signs of temperature inversions include smoke or dust hanging in the air and moving horizontally just above the surface, distant sounds becoming easier to hear, and smells becoming more distinct. Additionally, an inversion can be identified by examining the vertical profile of the atmosphere, also known as an Upper Air Sounding or a “Skew-T” in meteorological terms.
Skew-T Diagrams
A Skew-T diagram, also known as an Upper Air Sounding or a Skew-T Log-P diagram, is a graph that meteorologists use to analyze the vertical profile of the atmosphere. It is created from data collected by weather balloons, which measure temperature, dew point, wind speed, and other atmospheric variables at various heights in the atmosphere.
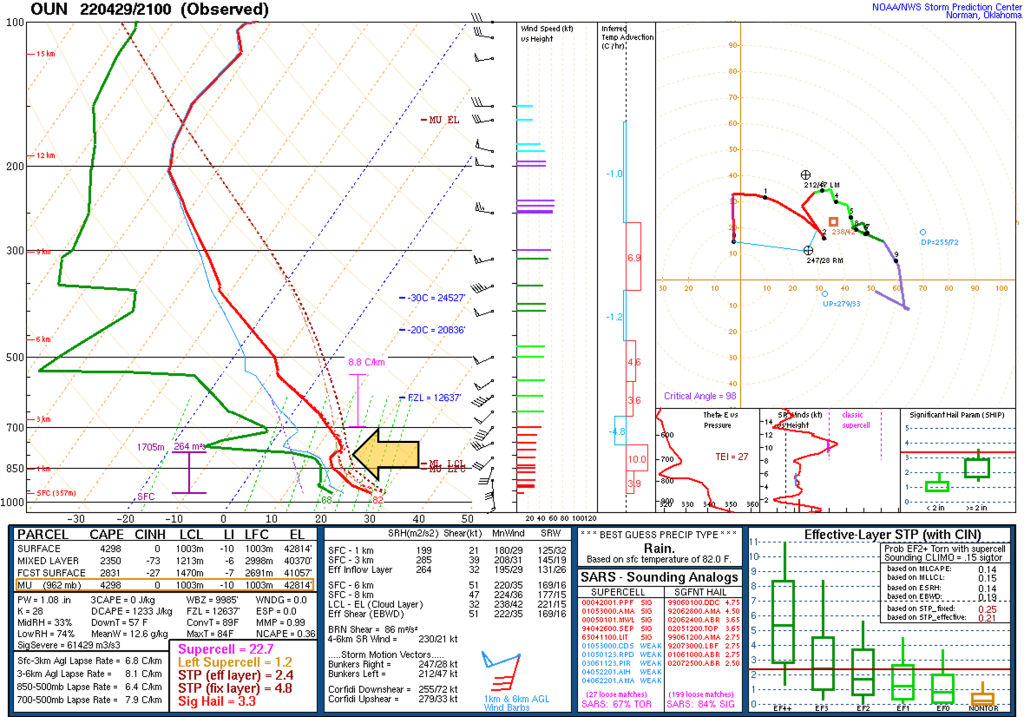
To identify a temperature inversion using a Skew-T diagram, meteorologists look for a reversal in the normal temperature profile. Under normal conditions, the temperature of the air decreases with increasing elevation. However, during an inversion, the temperature profile is reversed, and the air becomes warmer with increasing elevation. This reversal can be seen on a Skew-T diagram as a region where the temperature line (usually red) slopes to the right instead of to the left.
In addition to the temperature profile, a Skew-T diagram also provides information about other atmospheric variables, such as dew point temperature and wind speed. By analyzing these variables in conjunction with the temperature profile, meteorologists can gain a better understanding of the atmospheric conditions and make more accurate weather forecasts.